Market Volatility – Traders Must Adapt Or Risk Losing Their Shirts
Market volatility remains elevated and may be setting the stage for spikes even higher than we have already experienced.
Global money is continuing to flow into the US Dollar making it one of the primary safe-haven trades. This may eventually trigger a broader and deeper selloff in U.S. stocks. As the USD continues to strengthen corporate profits for US multinationals will begin to disappear.
It’s imperative to assess your trading plan, portfolio holdings, and cash resources. Experienced traders know what their downside risk is and adapt as needed to the current market environment.
If you still have money invested in Amazon, Netflix, PayPal, or one of the many other stocks that are sinking fast there is no easy way out. Your options are:
- Hold tight and “hope” for a rally to recover part of your money.
- Reduce some of your position to “limit your downside” in case the bottom really falls out, and then sell the balance after a bounce of 5-8%.
- Move to cash, “bite the bullet”, get a good night’s sleep, take a break, reassess, and live to come back and trade another day.
NASDAQ ENTERS BEAR MARKET TERRITORY
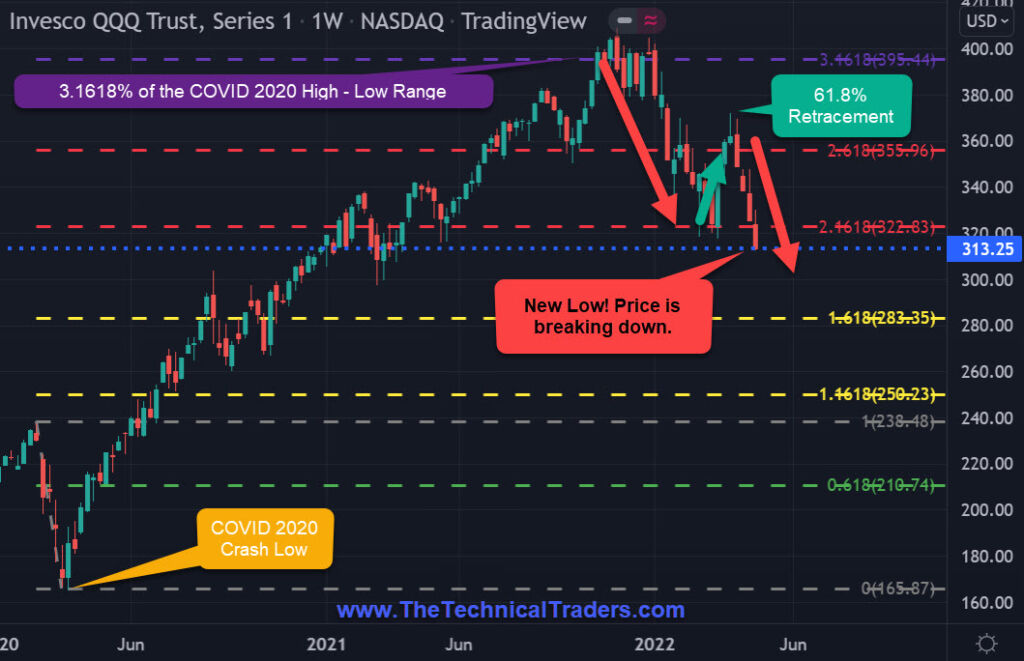
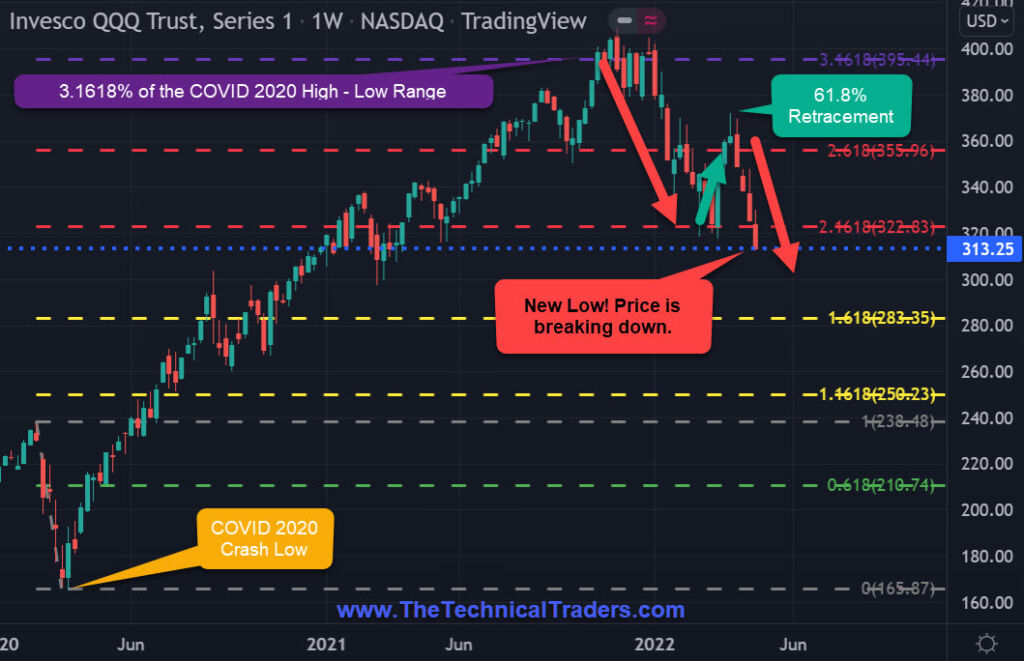
The NASDAQ peaked at around 3.1618% of its Covid 2020 high-low range the week of November 21, 2021.
- THEN – the QQQ ETF’s first swing down was -21% over a 16-week period (4 months).
- THEN – a brief 3-week rally, retraced around 61.8%.
- THEN – resumed its downtrend by taking out its previous low.
THEREFORE – according to the -20% Bear Market Rule: QQQ – 23.32% from its peak and -21.27% YTD is in a bear market.
QQQ • INVESCO QQQ ETF TRUST • NASDAQ • WEEKLY

AMAZON BREAKING DOWN -35%
Amazon AMZN peaked at around 3.1618% of its Covid 2020 high-low range the week of July 12, 2021.
- THEN – AMZN made a double top the week of November 15, 2021.
- THEN – the first swing down was -28.91% over a 16-week period (4 months).
- THEN – after a brief 4-week rally, retraced a little more than 61.8% of its initial downswing.
- THEN – resumed its downtrend by taking out its previous low.
THEREFORE – according to the -20% Bear Market Rule: AMZN -35.74% from its peak and -25.39% YTD is in a bear market.
AMZN • AMAZON.COM, INC. • NASDAQ • WEEKLY

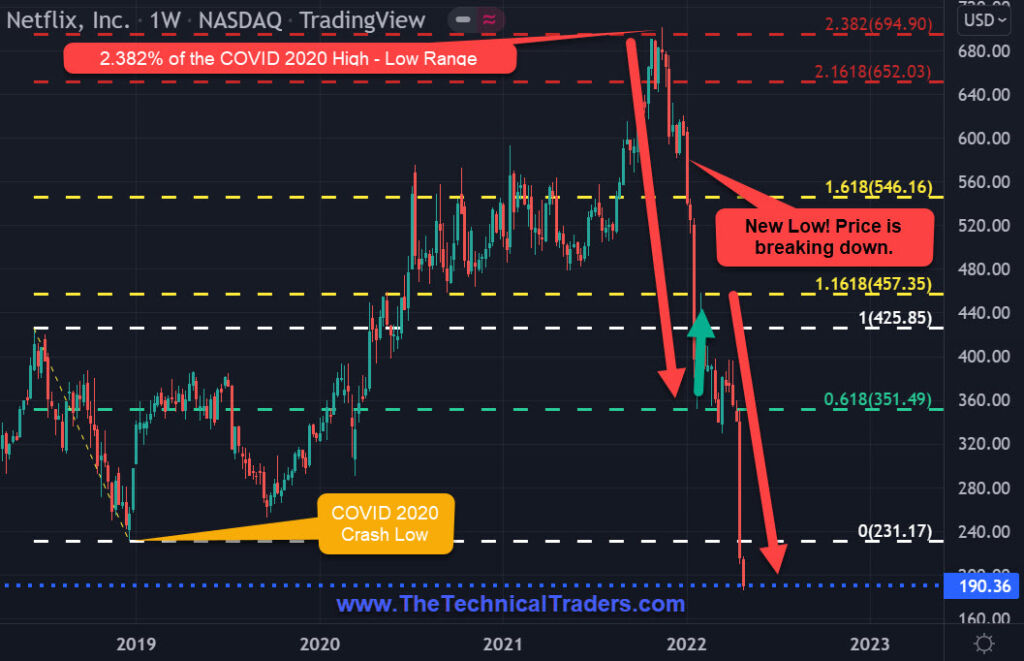
NETFLIX PLUMMETS -72% IN 5 MONTHS
Netflix NFLX peaked at around 2.382% of its Covid 2020 high-low range the week of November 15, 2021.
- THEN – NFLX’s first swing down was -17% over a 5-week period.
- THEN – a brief 3-week rally, NFLX retraced only 25%.
- THEN – the second swing down was -43% over a 4-week period.
- THEN – only less than a 2-week rally retraced around 33%.
- THEN – resumed its downtrend by taking out its previous low.
THEREFORE – according to the -20% Bear Market Rule: NFLX – 72% from its peak and -68.40% YTD is most definitely in a bear market.
NFLX • NETFLIX, INC. • NASDAQ • WEEKLY

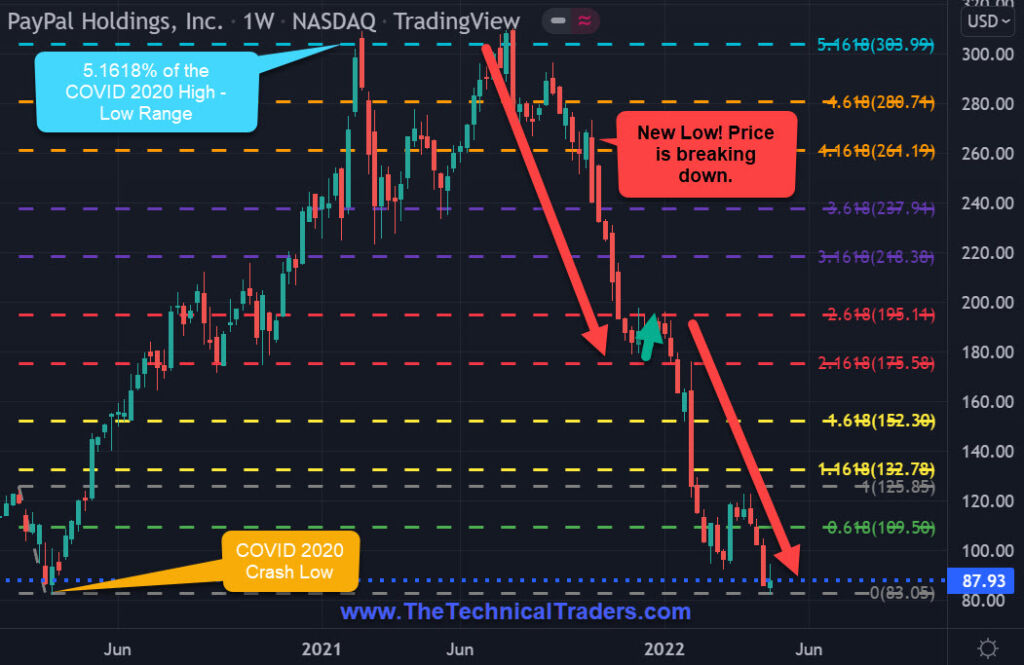
PAYPAL DROPS -73% IN 9 MONTHS
PayPal PYPL peaked at around 5.1618% of its Covid 2020 high-low range the week of February 16, 2021.
- THEN – PYPL put in a double top the week of July 26, 2021.
- THEN – the first swing down was -14% over a 4-week period.
- THEN – a brief 4-week rally, retraced about 61.8%.
- THEN – the second swing down was -39% over a 14-week period (3.5 months).
- THEN – a 6-week sideways rally retraced only around 10%.
- THEN – resumed its downtrend by taking out its previous low.
THEREFORE – according to the -20% Bear Market Rule: PYPL – 73% from its peak and -53.39% YTD is most definitely in a bear market.
PYPL • PAYPAL HOLDINGS, INC. • NASDAQ • WEEKLY

DRAWDOWNS HAVE A CRITICAL IMPACT
We need to remember the larger the loss the more difficult it is to make up. A loss of 10% requires an 11% gain to recover, however, a 50% loss requires a 100% gain to recover, and a 60% loss requires an even more daunting 150% gain to simply return to break even.
Recovery time also varies significantly depending upon the magnitude of the drawdown. A 10% drawdown can typically be recovered in weeks or a few months while a 50% drawdown may take several years to recover. Depending on a trader’s age they may not have the time to wait on the recovery nor the patience. Therefore, successful traders know it’s critical to keep their drawdowns within reason as most of them this principle the hard way!
prepare yourself for Market Volatility
Especially in times like these, traders must understand where opportunities are and how to turn this knowledge into profits. As our models generate new information about trends or a change in trends, we will communicate these signals expeditiously to our subscribers and to those on our trading newsletter email list. Our core objective is to protect our valuable capital while identifying suitable risk vs reward opportunities for profits in new and emerging trends.
Sign up for my free trading newsletter so you don’t miss the next opportunity!
As technical traders, we follow price only, and when a new trend has been confirmed, we change our positions accordingly. We provide our ETF trades to subscribers. Recently, we entered new trades, all of which hit their first profit target levels and then eventually triggered their break-even profit stop-loss orders on their remaining position. After booking our profits we are now safely in cash preparing for our next trades. Our models continually track price action in a multitude of markets and asset classes as we track global money flow. As our models generate new information about trends or a change in trends, we will communicate these signals expeditiously to our subscribers and to those on our trading newsletter email list.
WHAT STRATEGIES CAN HELP YOU NAVIGATE The CURRENT MARKET TRENDS?
Learn how we use specific tools to help us understand price cycles, set-ups, and price target levels in various sectors to identify strategic entry and exit points for trades. Over the next 12 to 24+ months, we expect very large price swings in the US stock market and other asset classes across the globe. We believe the markets have begun to transition away from the continued central bank support rally phase and have started a revaluation phase as global traders attempt to identify the next big trends. Precious Metals will likely start to act as a proper hedge as caution and concern begin to drive traders/investors into Metals and other safe-havens.
Historically, bonds have served as one of these safe-havens, but that is not proving to be the case this time around. So if bonds are off the table, what bond alternatives are there and how can they be deployed in a bond replacement strategy?
We invite you to join our group of active traders and investors to learn and profit from our three ETF Technical Trading Strategies. We can help you protect and grow your wealth in any type of market condition by clicking on the following link: www.TheTechnicalTraders.com
Chris Vermeulen
Chief Market Strategist
Founder of TheTechnicalTraders.com
The post Market Volatility – Traders Must Adapt Or Risk Losing Their Shirts appeared first on Technical Traders Ltd..


