Predictive Modeling Suggests 7~10% Rally In SPY/QQQ Before April 2022
Has the Santa Rally arrived late this year? Are traders trying to position for a Q4:2021 earnings blowout before the end of 2021? Let’s take a look at what predictive modeling can help us understand.
The recent rotation in the SPY/QQQ has shaken some traders’ confidence in the ability of any potential rally – blowing up expectations of a Santa Rally. Yet, here we are with only five trading days before the end of 2021, and the US major indexes are nearing all-time highs again.
Predictive Modeling Shows A Continued Melt-Up Trend Through Jan/Feb 2022
Our Adaptive Dynamic Learning (ADL) Predictive Modeling system may hold the answers you are looking for. Let’s look at a few charts to prepare for what may unfold over the next 60+ days.
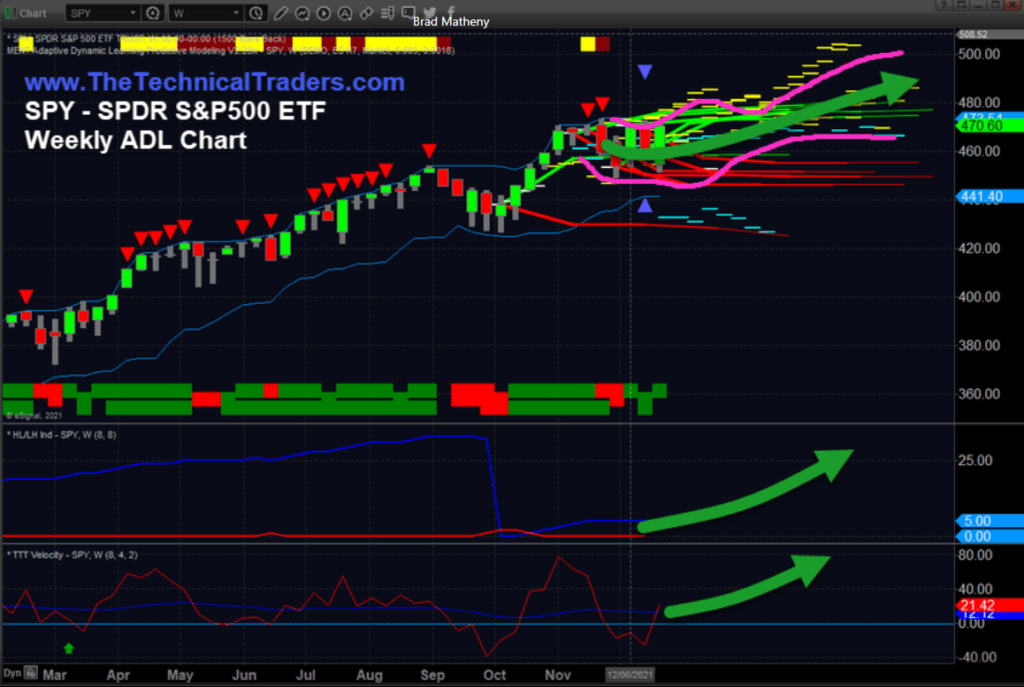
First, this SPY Weekly ADL chart highlights the range of potential outcomes going forward into March/April 2022. The further out we attempt to predict using this technique, the more opportunity exists for outlier events (unusual price trends/activity). Yet, the SPY ADL predictive modeling system suggests a very strong upward price trend in January/February 2022, with a possible narrowing of price in late February – just before another big move higher in March/April 2022.
There is an outlier trend that appears below the current price trend. So far, this outlier trend has not aligned with price action over the past 5+ weeks and shows an alternate support level near 0.
Sign up for my free trading newsletter so you don’t miss the next opportunity!
The ADL predictive modeling system suggests a broad market uptrend is likely in the SPY, with an initial target near 0 possibly being reached by early February. If Q4:2021 earnings come in strong and revenues continue to impress the markets, we may see a rally above the 0 level before the end of February 2022.
After the tightening of price near the end of February 2022, it appears the SPY will consolidate near 0, then enter another rally phase and attempt to rally above 0. This type of price action aligns with solid Q4:2021 expectations and continued Q1:2022 economic growth.

ADL Predicts QQQ Will Rally Above 0 By March/April 2022
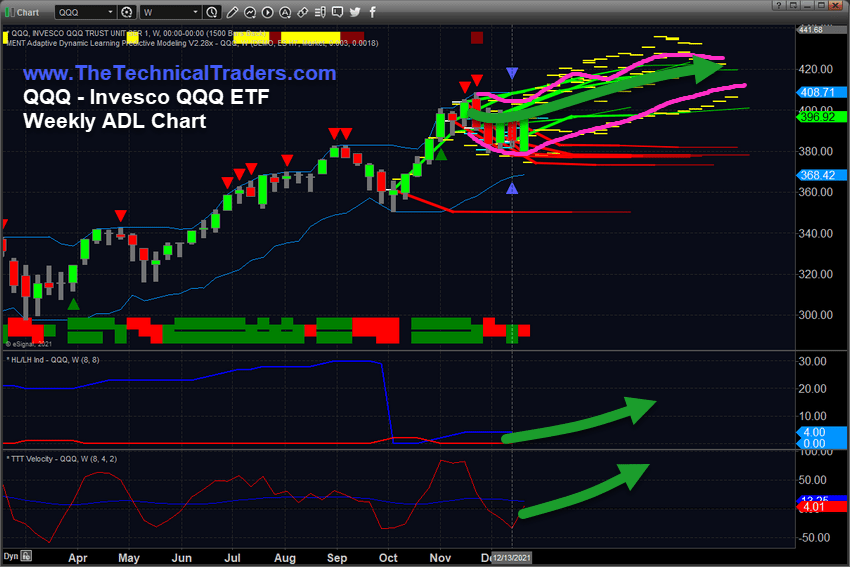
This Weekly QQQ ADL Chart highlights a similar type of price trend compared to the SPY. The QQQ appears to have a more consistent upward trend bias with a fairly solid upward price channel trending through the first four months of 2022. It appears the QQQ will rally to levels above 0 by mid-February 2022, then stall for a few weeks, then resume a rally trend through most of March 2022 and into early April 2022. After mid-April 2022, it appears the QQQ will consolidate, again, near the 0~5 level.
This ADL prediction suggests Technology, Healthcare, Consumer stables/discretionary, Real Estate, and other sectors will continue to do well in Q1:2022 and beyond. A rally of 7% to 10% in the first few months of 2022 may send the US markets dramatically higher throughout the rest of 2022 if economic growth stays strong.

The ADL predictive modeling system has proven to be a valuable tool in understanding what lies ahead for the markets. Not only does it show a range of potential outcomes and price targets, but it also helps us understand if and when price breaks beyond these ADL predictive ranges (which translates into a unique price anomaly).
Price anomalies happen. The COVID-19 price collapse represented a unique price anomaly in 2020. This event, somewhat like a Black Swan event, hit the markets hard and quickly sent prices tumbling. It is important to understand that these events can still happen in the future and can dramatically disrupt expected price trends.
Still, if the ADL predictive price trends continue to be accurate, it looks like Q1:2022 and Q2:2022 may continue to see moderate upward price trends with bouts of sideways volatility taking place. The range of the ADL predictive levels (the MAGENTA LINES) shows the type or expected volatility in the markets for Q1 and Q2. It appears volatility will stay elevated over the next 6+ months – so get ready for some big, explosive price trends.
Watch for the markets to continue to melt higher over the next few weeks as traders prepare for Q4:2021 earnings to start hitting in early January 2022. We may see the US markets start another big upside price trend – possibly breaking to new all-time highs soon enough.
Want to learn more about predictive modeling?
Learn how I use specific tools to help me understand price cycles, set-ups, and price target levels in various sectors to identify strategic entry and exit points for trades. Over the next 12 to 24+ months, I expect very large price swings in the US stock market and other asset classes across the globe. I believe the markets are starting to transition away from the continued central bank support rally phase and may start a revaluation phase as global traders attempt to identify the next big trends. Precious Metals will likely start to act as a proper hedge as caution and concern start to drive traders/investors into Metals.
Please take a minute to visit www.TheTechnicalTraders.com to learn about our Total ETF Portfolio (TEP) technology and how it can help you identify and trade better sector setups. We’ve built this technology to help us identify the strongest and best trade setups in any market sector. Every day, we deliver these setups to our subscribers along with the TEP system trades. You owe it to yourself to see how simple it is to trade 30% to 40% of the time to generate incredible results.
Have a great day!
Chris Vermeulen
Chief Market Strategist
The post Predictive Modeling Suggests 7~10% Rally In SPY/QQQ Before April 2022 appeared first on Technical Traders Ltd..


