IWM Rally May Find Brief Resistance Near $244~$245 Before Rocketing Higher
Watching the US Stock Market start a big rally phase after the October 12th base/bottom raised a few questions in my head because the Small-Caps/Mid-Caps were not showing a strong upward price trend like the rest of the market. Even though I called this upward price trend many weeks before it happened, I was surprised that the Small-Caps/Mid-Caps lagged the S&P500, Dow Jones, and NASDAQ as the rally initiated.
I wrote about this setup in the IWM recently and detailed my expectations in these articles/posts:
- October 20, 2021: S&P500 RALLIES ABOVE $4400 – MAY ATTEMPT TO ADVANCE TO $4750~$4800
- October 19, 2021: CHRIS VERMEULEN: STOCKS TOP OUT IN 2022 TO START NEXT RALLY FOR GOLD AND SILVER
- August 25, 2021: IWM SETS UP DUAL PENNANT/FLAG FORMATION – SUGGESTING VERY VOLATILE APEX EVENT
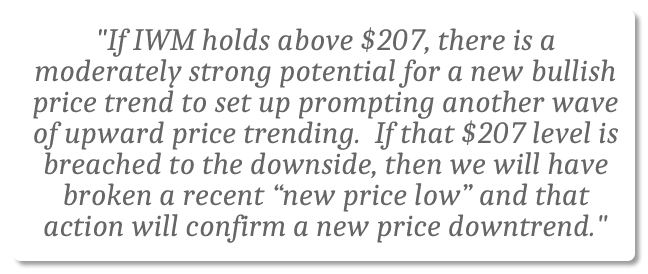
Within my August 25, 2021 article, I was very clear that the $207 level was acting as critical support as IWM transitioned into the APEX of the dual Price Flag formation.

The $207 low, which was set on March 5, 2021, established a unique price low that traders could use as a “make-or-break” level in the event of a bigger breakdown in price. If that $207 level was breached by a strong downside price trend, then I would have expected an even bigger breakdown event to take place.
Watch For Resistance Near $245 On IWM
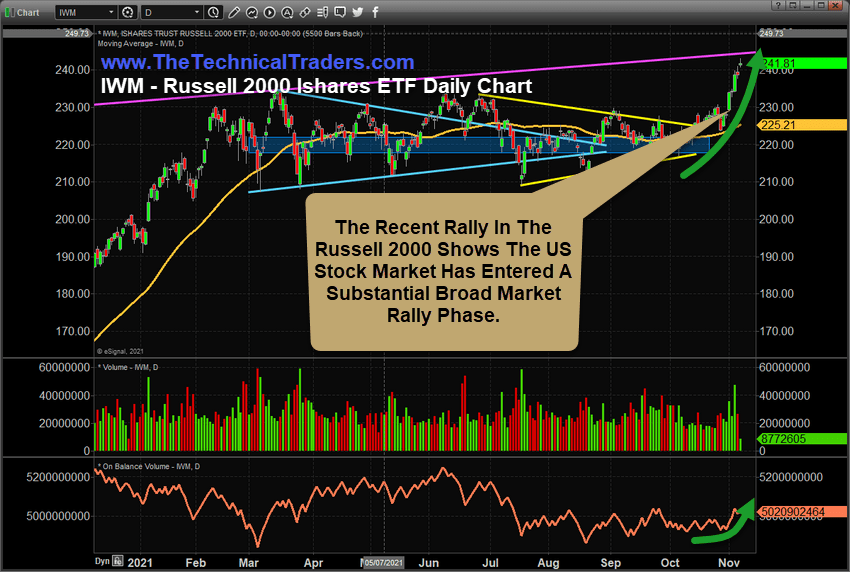
In early October, IWM started to narrow into a price range between $217 and $225. Then, on October 14, 2021, a mild upside price gap was set up. I expected more volatility in price at this time as the other US major indexes were starting to rally quite strongly. IWM started a bigger upside price trend nearly two weeks later, near October 29, 2021, and started a big breakout rally phase in early November 2021.
Sign up for my free trading newsletter so you don’t miss the next opportunity!
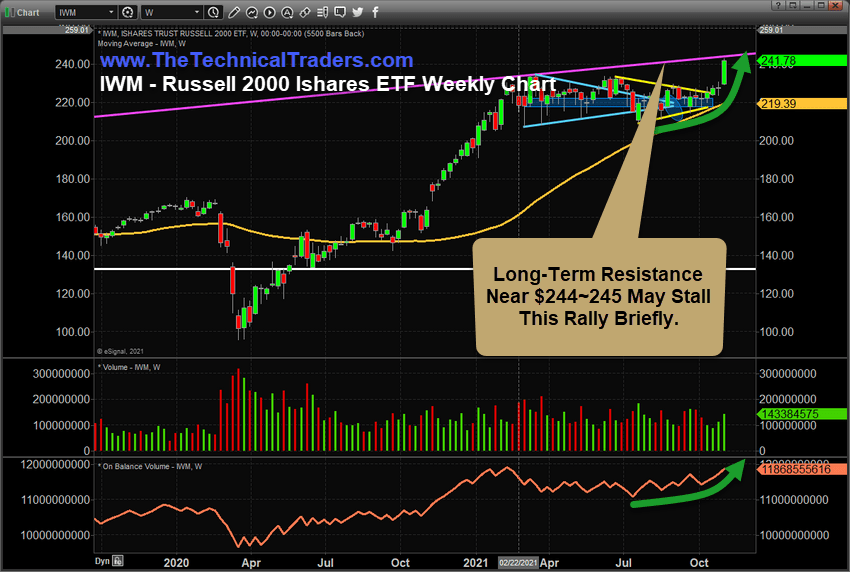
Long-term resistance, near $244~$245, may briefly pause this rally before price levels continue higher. This rally phase is showing very strong volume and accumulation as traders pile into the Christmas Rally trends.

Extended Congestion In Price Suggests $263~$264 Is Upside Target For IWM
When I look at the extended sideways price congestion phase on this Weekly IWM chart, below, I typically expect the price to break the congestion phase by a 100% range of the congestion. Using this theory, I believe the $263~$264 level will become the next immediate upside price target for IWM as this rally continues.
Another key facet of the extended congestion phase is the longer price stays in a congestion phase, the more volatile the breakout/breakdown in price may become. At this point, after more than 8 months of congestion, we may see IWM rally well into Q1:2022 and quite possibly rally well above my $263~$264 target level.

In closing, the most important aspect of this rally in the Russell 2000/IWM is that we are now seeing a very broad US stock market rally phase set up ahead of the typically strong Christmas Rally to close out the year. This is very exciting and opportunistic for traders that were positioned for a big rally.
My analysis suggests this rally may continue into early January 2022 – where my cycle analysis suggests a change in price trend may initiate after January 18th or so. Follow my research and learn how I use specific tools to help me understand price cycles, set-ups, and price target levels. Over the next 12 to 24+ months, I expect very large price swings in the US stock market and other asset classes across the globe. I believe the markets are starting to transition away from the continued central bank support rally phase and may start a revaluation phase as global traders attempt to identify the next big trends. Precious Metals will likely start to act as a proper hedge as caution and concern start to drive traders/investors into Metals.
Please take a minute to visit www.TheTechnicalTraders.com to learn about our Total ETF Portfolio (TEP) technology and it can help you identify and trade better sector setups. We’ve built this technology to help us identify the strongest and best trade setups in any market sector. Every day, we deliver these setups to our subscribers along with the TEP system trades. You owe it to yourself to see how simple it is to trade 30% to 40% of the time to generate incredible results.
Chris Vermeulen
The post IWM Rally May Find Brief Resistance Near $244~$245 Before Rocketing Higher appeared first on Technical Traders Ltd..


