When Divorce Happens: The Nasdaq & Transportation Index Diverge In Big A Way Which Can Signal A Weakening Economy
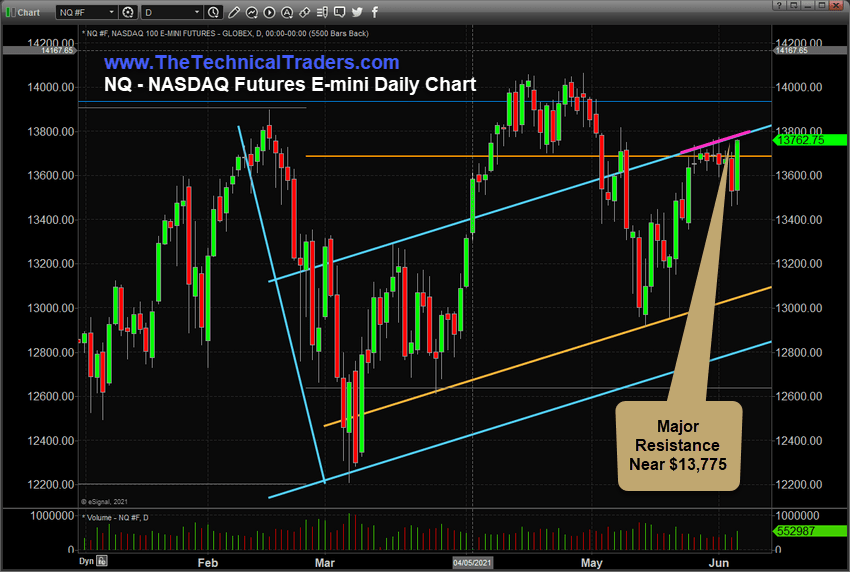
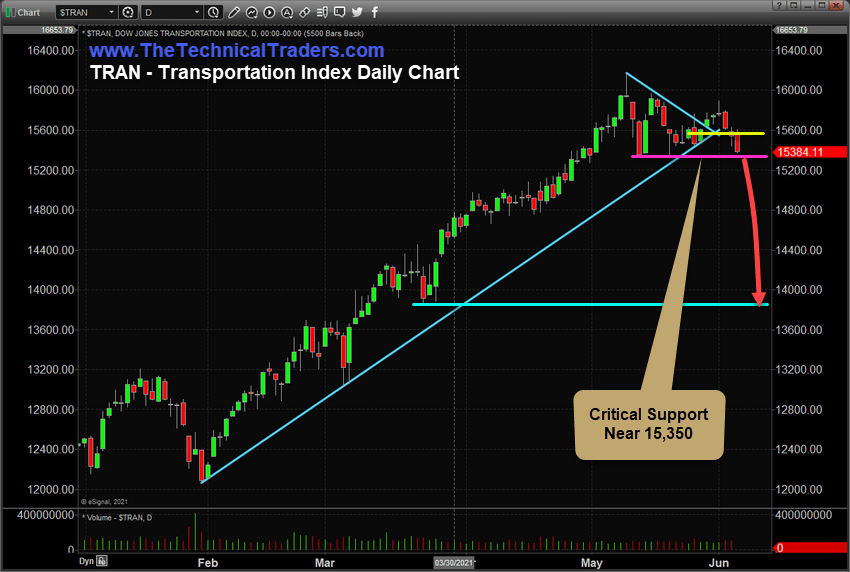
On Friday, June 4, 2021, a very interesting divergence between the NASDAQ and the Transportation Index setup which highlights the uncertainty related to the continued global market recovery trade. With the NASDAQ rallying over 200 points and reaching levels near critical resistance, near $13,775, the Transportation Index collapsed over -150 points and briefly tested critical support near $15,350. What would prompt this type of movement in these indexes?
I believe the recovery/reflation trade has already run it’s course and we are starting to move into a complacency phase with regards to future economic activity and output. Consumers are already fairly settled after the past 15+ months of COVID lockdowns. They’ve either adjusted to the new work-at-home requirements or they have relocated into areas that allow them to move forward with their lives without having to expend more capital. For those who were not able to make these moves already, the inflationary impact on consumer prices of homes, commodities, food and other items may keep them from making any big financial decisions as they continue to try to deal with higher costs.
Sign up for my free trading newsletter so you don’t miss the next opportunity!
The markets, meanwhile, continue to attempt to engage in a rally phase that has been driven by euphoric expectations related to the recovery/reflation of the global economy. There are, however, still a few speed bumps ahead that may change how traders perceive opportunity.
First, BASEL III (new regulations come into effect June 27th) will come to disrupt the global banking constructs and may send precious metals skyrocketing as it threatens how banks and others report physical and non-physical precious metals supplies. This is very important for traders to understand because the impacts on global central banks and how the markets react to this disruption are still unknown. You can read more about BASEL III and what may happen to the markets in this recent article from goldsilverpros.com.
Second, as BASEL III moves closer to disrupting the markets, we believe the markets will start to see liquidity and volatility issues as traders shuffle capital around in an attempt to avoid the unknown factors related to credit/debt risks throughout the rest of 2021. If we were to consider the potential of a revised post-COVID recovery/reflation market economy and the new BASEL III requirements on banks and credit institutions across the planet, could we be seeing a flat/sideways market moving in preparation for some type of unrest in the near future?
Lastly, the post-COVID world economy will likely continue to struggle to reach previous levels of activity as various strains of the COVID virus continue to disrupt world economies and as supply-side disruptions continue to prompt excessive price advances. Consumers won’t chase price levels higher and higher in a flattening or contracting global economic environment. They will be left to make a choice between what is needed vs wanted – and need will always win over wants.
It’s the opinion of my team and I that we’ve already reached the summit of the recovery/reflation rally and anything that continues to push the markets higher at this point is likely to be an exhaustion rally. The expectations that we would bounce back to pre-COVID levels (or more) in terms of consumer engagement and activity may still be many years away. We strongly believe a type of malaise will overcome the markets as we move towards the end of 2021 where economic data and earnings will stagnate while inflation and cost factors continue to be elevated. This is Stagflation by all forms – on a global basis.
NASDAQ Stalling (Again) Near $13,775
We are watching the $13,775 level on the NASDAQ as a strong resistance level and watching how fragile the recent downside rotation from the $14,070 NASDAQ highs continues to play out. If the NASDAQ fails near this resistance level and moves lower, we would consider this confirmation of a sideways flagging price pattern that aligns with our Excess Phase Peak research – which we first highlighted in November 2020. The divergence between the NASDAQ and the Transportation Index suggests global traders believe the economy is not as robust as some still hope for.

Transports Trying To Hold Above $15,350
This Transportation Index Daily chart shows how the Belt-Hold line (the YELLOW line) has been breached and the lower support channel near $15,350 is not being targeted. Once this support level is broken, we believe a broad downside move will take place which may target the lower CYAN level near 13,850. We are seeing very interesting price divergence while the Transportation Index has moved below the Belt-Hold level (a sign of weakness) which suggests global traders are expecting a weakening economy in the near future.
When the Transportation Index moves lower, overall, we should consider this a warning that global traders believe the economy will weaken and that the demand for goods and materials will weaken going forward. That is why we are watching the $15,350 support level with such intensity. If this level is breached, it may mark the start of a bigger downside trend in the Transports and suggest the complacency in the US/Global markets is unfounded.

One thing is very certain with the markets reacting as they are near these recent all-time highs – we live in interesting times.
We recently published an article explaining how the new Depreciation market cycle phase will prompt a big rally in Precious Metals and prompt a bigger global market rotation over the next 3+ years.
Next week, we may see more clarity regarding this divergence between the NASDAQ and the Transportation Index. For right now, we consider this a warning that the markets appear to be dislocating from previous trending and could possibly initiate a new type of trending soon.
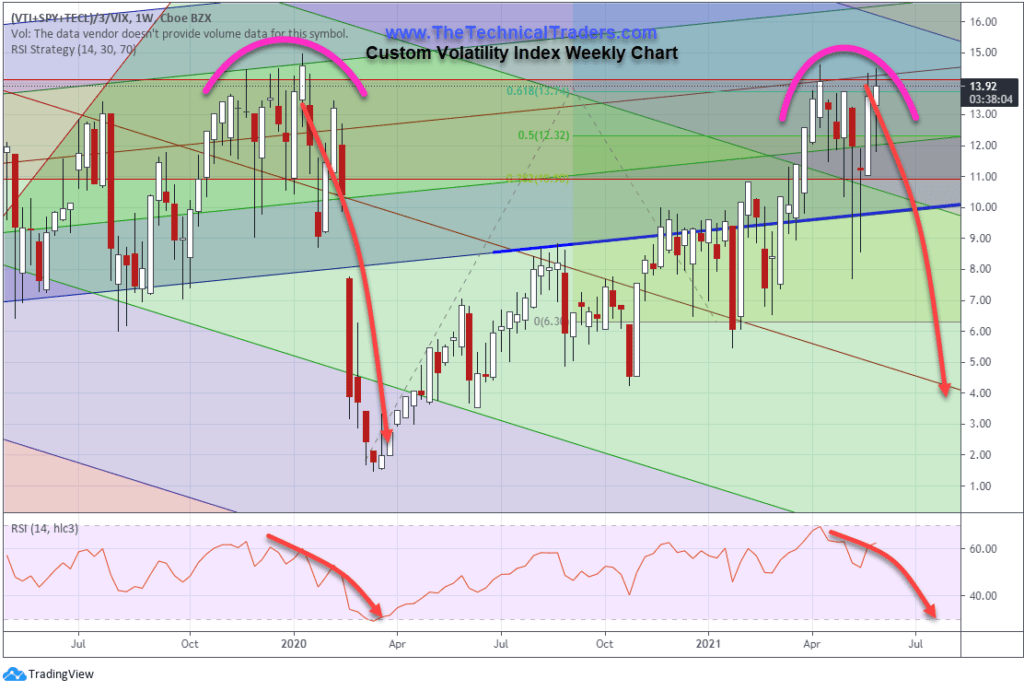
I’ll close out this article by sharing my Custom Volatility Index chart and the current near extreme high price level at 13.92. You can see from this chart that when the Custom Volatility Index reaches these extreme high levels, which we call the topping range, subsequent downside price trends are typically a minimum of 8% to 12% and can sometimes prompt very big downside price trends in excess of -25% (like in 2018 and 2020). This is complacency in an uptrend – waiting for something to breakdown.

Take advantage of the time you have before BASEL III and the end of June prompt some big market trends. 2021 and beyond are going to be incredible years for traders. Staying ahead of these sector trends is going to be key to developing continued success in these markets. As some sectors fail, others will begin to trend higher.
Learn how my BAN Trader Pro Strategy can help you identify and trade better sector setups. My team and I built this technology to help us identify the strongest and best trade setups in any market sector. Every day, we deliver these setups to our subscribers along with the BAN Trader Pro system trades. You owe it to yourself to see how simple it is to trade 30% to 40% of the time to generate incredible results.
Have a fantastic weekend!
Chris Vermeulen
Founder & Chief Market Strategist
www.TheTechnicalTraders.com


