How HIGH Can It Fly? Tilray And Cannabis ETF (MJ) Prepare To Rally 25% More To The Upside
Over the past few weeks, a unique opportunity continues to unfold in the Cannabis & Marijuana sector. I highlighted this near the end of May 2021 with a research article showing how a multiple upside price wave setup may start to unfold after a recent momentum base/bottom setup across various cannabis/marijuana sector symbols. The confluence of price patterns across a number of cannabis sector stocks suggests a bigger price trend may be about to setup. My team and I believe this new momentum base/bottom may prompt a strong upside price trend throughout the end of 2021 and may prompt a continuation of this trend into 2022.
Sign up for my free trading newsletter so you don’t miss the next opportunity!
Today, I am revisiting these same charts/symbols to see how far things have progresses since our May 31, 2021 research post. Let’s get started with the charts.
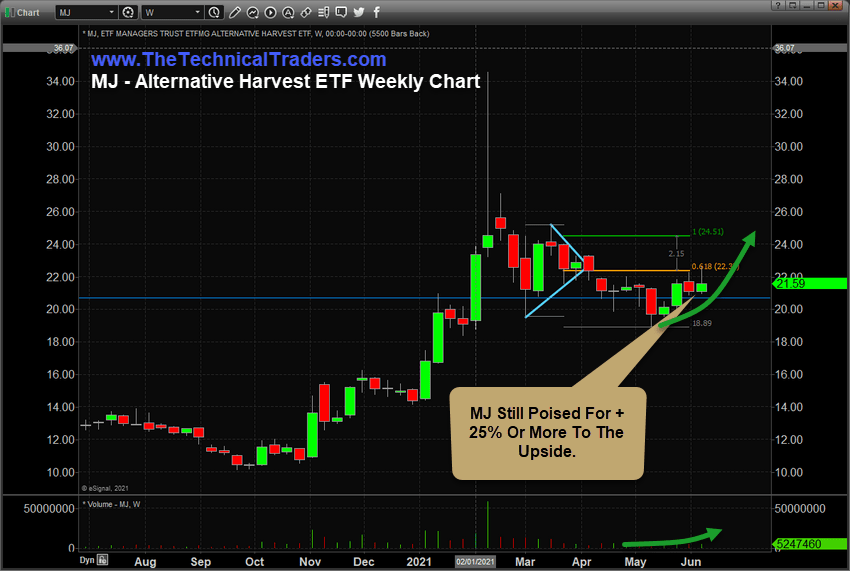
MJ Still Setup For A +14% Rally To Levels Near $24.50 (Or Higher)
This Weekly MJ chart shows the deep momentum base/bottom near $19.90 with moderate upside support above $20 to $21. Using a Fibonacci 100% Measured Move technique, we can identify upside targets near $22.40 and $24.50. Over the past two weeks, MJ actually reached the $22.40 target with recent highs. Yet, price closed the week lower, near $21.59.
I am also seeing strong trading volume as this new upside price trend extends higher. This increased volume is a good indication that the upside price trend is starting to build momentum as traders accumulate shares in anticipation of the bullish price rally phase.
My team and I still believe the upside potential in the Cannabis/Marijuana sector is relatively strong. We believe the recent momentum base that setup across numerous Cannabis sector stocks is presenting a very clear opportunity for traders to position trades for the pending multi-wave upside price trends. After the first Fibonacci 100% Measured Move targets are reached, a brief pause in price should be expected, then another upside price trend should prompt an even higher price advance. This next move will likely conform for the current rally attempt as another Fibonacci 100% Measured Move to the upside.

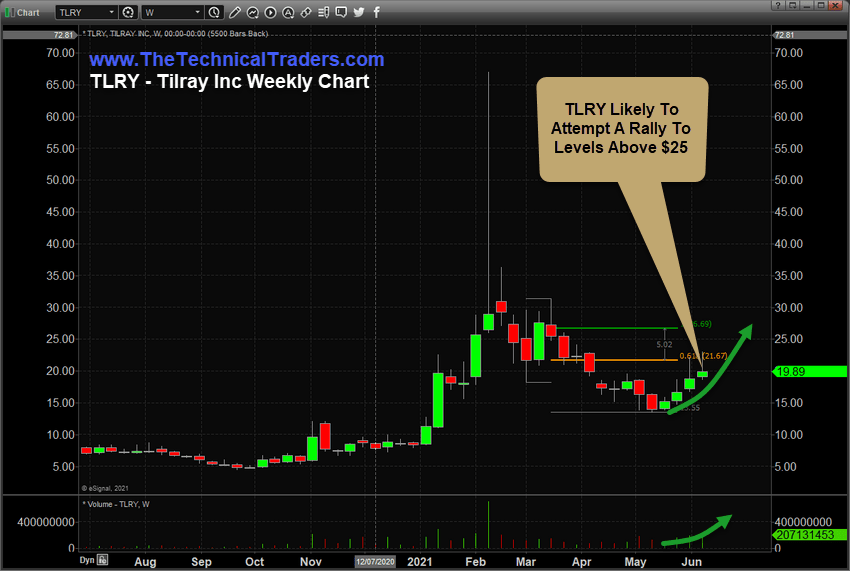
Tilray Inching Higher – Still Showing A Potential For A +35% Advance
Very similar to the MJ Weekly chart setup, this Weekly TLRY chart shows a fantastic momentum advance after a moderate price pullback from recent highs. Although recent highs have touched our first Fibonacci target level, near $21.67, there is still ample opportunity for a move to the second target level near $26.70.
We are seeing strong accumulation in the recent trading volume indicated by the series of GREEN candles – suggesting the upside price trend is starting to build real momentum. We believe the next move higher will target the $23 to $24 level – which will prompt a close above the first target level and setup TLRY on a stronger advance towards the second target level.
From the current price close, the second target level, near $26.70, represents a solid +35% opportunity for traders to profit from this initial wave higher.

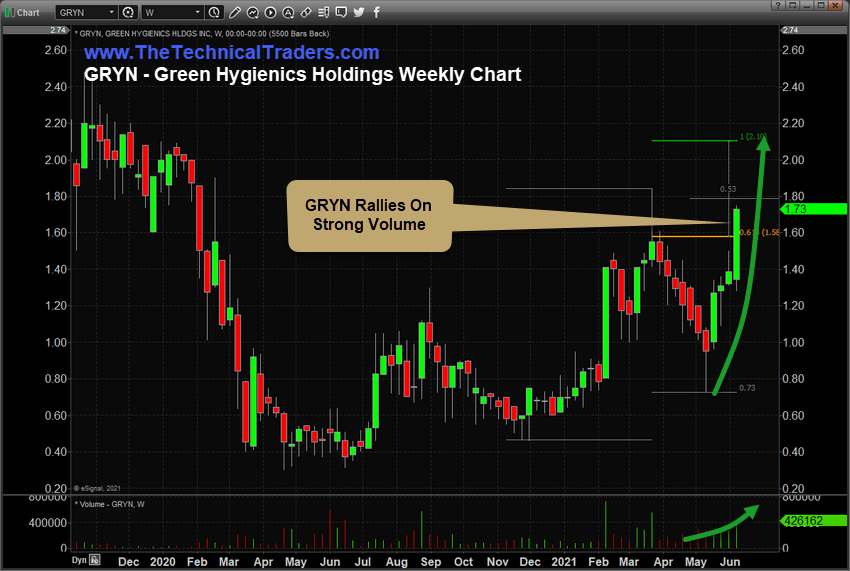
GRYN Makes A Big Move – Still Showing Opportunities For Another +22% Advance
In our first research article about this unique setup in the Cannabis/Marijuana sector, we includes GRYN as a potential candidate for an explosive upside trend. GRYN is not one of the most heavily traded symbols in this sector, yet we feel it is uniquely positioned because it is working towards US FDA approval for its Hemp-based CBD growing and extraction processes. Once they get US FDA approval, it means GRYN can produce and sell into almost any medical, consumer, beverage, consumable or other industry as an FDA Approved supplier.
Recently, we saw a big upside in GRYN, rallying over 32% since we first published our May 31 research article. The next move higher should target levels above $2.21 and setup a new range for the next Fibonacci 100% Measured Move higher. If GRYN rallies to a high near $2.50 in this current trend, then the next Measured Move upside targets will be $2.79 to $3.45 if the $1.65 to $1.70 price level holds as support. These approximate (estimated) upside targets represent another +60% to +98% rally phase for GRYN.

Overall, we believe the Cannabis/Marijuana/Alternative Medicine sector has moved away from the downside price trend that has dominated this sector over the past 2 to 3+ years. Now, after the Reddit group targeted this sector late in 2020, we are seeing renewed focus by traders into this sector. Once the momentum moves past moderate accumulation and into breakout trending, we may see another big explosive upside trend in a number of Cannabis sector stocks.
The one thing that could deflate this trend is if we start to see a broad US/Global market price correction. If something like a moderate 11% (or greater) US/Global market downtrend sets up, then we will likely see these Cannabis/Marijuana sector stocks attempt to move lower as well – attempting to reset/retest the recent momentum base levels. This would present a very interesting opportunity for traders to get into positions as these base levels setup and as the accumulation starts to build again.
Want to know how our BAN strategy is ranking the Cannabis/Marijuana sector (and other sectors) for trading opportunities to identify the best opportunities for future profits? Please take a minute to learn about my BAN Trader Pro newsletter service and how it can help you identify and trade better sector setups. My team and I have built this strategy to help us identify the strongest and best trade setups in any market sector. Every day, we deliver these setups to our subscribers along with the BAN Trader Pro system trades. You owe it to yourself to see how simple it is to trade 30% to 40% of the time to generate incredible results.
Have a great Monday!
Chris Vermeulen
Chief Market Strategist
www.TheTechnicalTraders.com


