Watch Crude Oil & Transports For Continued Support Of This Rally
Both Crude Oil and the Transportation Index are likely to show us the future of the US/Global market trends over the next few days/weeks. Crude Oil supply and demand will highlight how traders/investors perceive the Summer economic recovery taking place. The Transportation Index will highlight how traders/investors perceive the continued demand for raw materials, retail products and how active consumers are throughout the Summer months.
These two key components often react to market trends and expectations and often lead the markets in terms of general market psychology. When traders/investors perceive a growing economy, higher demand for travel, manufacturing, and retail activity, then both Crude Oil and the Transportation Index typically rally ahead of these expectations. When traders/investors perceive a slowing or contracting economy, demand for Oil and Transports decline as manufacturing and retail slows and as the need to transport final goods or general consumer demand for oil contracts. We believe these two sectors may present a very clear trigger of what to expect over the next few weeks and months depending on how they react after breaching the Flag/Pennant formations shown on the charts below.
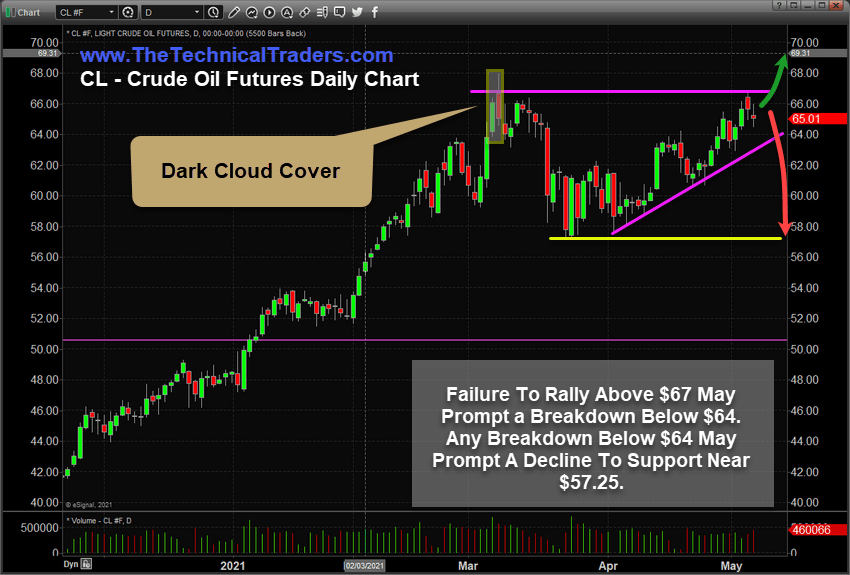
Crude Oil Nearing Apex After Peaking Near $68.00
First, let’s start with a Daily Crude Oil chart below. We’ve highlighted the Flag/Pennant formation in MAGENTA on this chart and we’ve also highlighted recent support near $57.25. The previous peak level, near $67.98, represents a key resistance level on this chart. Particularly, we’ve focused on the Opening Price of that bar, at $66.68, as a key resistance level. We believe the new high on that bar, followed by the deep decline prompting a close well below the previous bar’s closing price, shows a very defined reversal pattern. In Japanese Candlestick Terms, this peak rotation created a Dark Cloud Cover pattern – which often represents a critical market top. The continued downward price trending after this pattern confirmed this Japanese Candlestick pattern, which adds greater weight to this Topping pattern.

If Crude Oil continues to rally as US consumer and manufacturing demand continues to increase, then we expect Crude Oil to attempt to rally above $66.68 near the Apex of the Flag/Pennant formation. This would likely prompt a rally above the $68.00 level fairly quickly.
Sign up for my free trading newsletter so you don’t miss the next opportunity!
If Crude Oil breaks down near the Apex of the Flag/Pennant formation, then we would watch for a breakdown below $64.00 as a confirmation that the upward sloping price channel has been breached – indicating a stronger downside price trend has setup. Ideally, the support level near $57.25 (the YELLOW line) would become critical support if a breakdown price trend takes place.
Strong Bullish Trending May Prompt Big Volatility In The Transportation Index
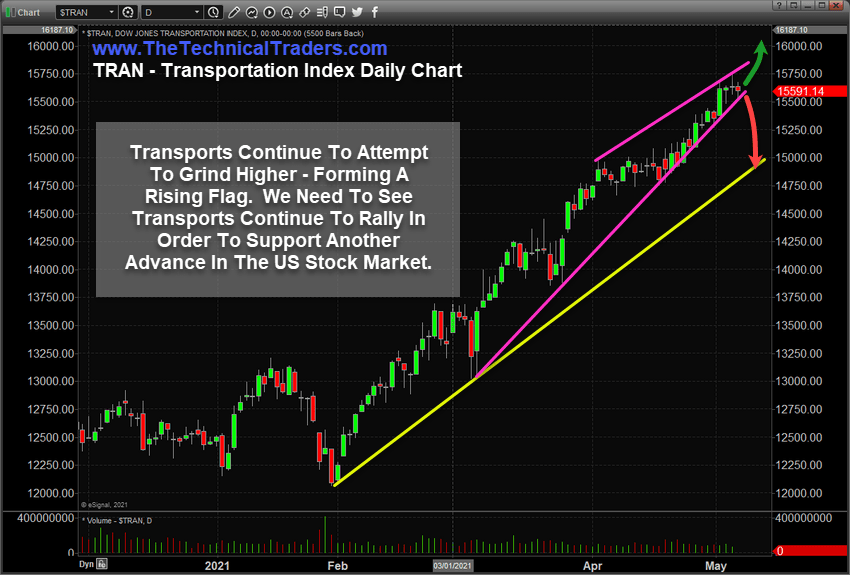
The Transportation Index Daily Chart shows a similar type of Flag/Pennant formation (the MAGENTA lines) as well as a sharply upward sloping price channel (the YELLOW line). The Transportation Index continues to grind higher as the US major indexes have shown some signs of weakness recently. This suggests that traders/investors believe the economic recovery will continue to strengthen in the future and dismisses recent weakness in the major markets.
The similarity between the Crude Oil chart and the Transportation Index chart, related to the Flag/Pennant formations, suggests the US major markets are preparing for a breakout or breakdown in price trend within the next 3 to 7+ days. These types of patterns usually prompt a fairly explosive type of price trend with increased volatility and the very strong potential for while sideways price rotation as the new trend and trend direction seeks to build momentum.
We feel the likelihood of a continued upside price trend is stronger than a big breakdown in trend at this time because we are starting to gain some momentum regarding the US economic recovery. Yet, when we take a look at this Transportation Index Daily chart, below, we can see a very clear and strong bullish price trend that has not experienced any moderate pullback over the past few months. Thus, some type of price volatility and the chance for a moderate downside technical correction in the Transportation Index is quite high right now.

In short, a moderate technical correction may be the most likely outcome of these Flag/Pennant formations as price nears the Apex of these setups. The continued bullish trending of the Transportation Index suggests traders/investors have actively priced a strong US economic recovery over the past 90+ days. After such a strong rally, a moderate downside technical correction in price is not uncommon – in fact, it is very healthy for the markets to continue to trend higher.
Volatility may shoot higher over the next few days/weeks as Crude Oil and the Transportation Index near the Apex of these Flag/Pennant formations. The VIX may skyrocket above 30 at some point if the technical breakdown seems somewhat aggressive.
We do believe the longer-term bullish trending will resume as we don’t see any systemic or critical risks in the markets currently. We are watching these two charts as we near the Flag/Pennant formation Apex levels because we believe the increased price volatility and aggressive price rotation usually associated with these Flag/Pennant Apex levels warrants some level of caution. Particularly, Gold and Silver have started to move higher recently and this suggests traders/investors are starting to shift into a “higher risk” type of expectation.
We should see the Apex of these Flag/Pennant formations start to take place before May 15, 2021. Get ready for increased volatility and the potential for a big breakout or breakdown in prices. We may see a 6% to 12% rotation in price levels across many US major indexes depending on how volatile price trends.
Smart traders will quickly identify these phases of the market and will understand how this Excess Phase rally should continue to play out. Ride it as long as you are able to profit from these trends – but be cautious of how, when, and how violently it will end. You can learn more about how I identify and trade these sectors by registering for my FREE step-by-step guide.
For those who believe in the power of trading on relative strength, market cycles, and momentum but don’t have the time to do the research every day then my BAN Trader Pro newsletter service does all the work for you with daily market reports, research, and trade alerts. More frequent or experienced traders have been killing it trading options, ETFs, and stocks using my BAN Hotlist ranking the hottest ETFs, which is updated daily for my premium subscribers.
Happy Friday!
Chris Vermeulen
Founder & Chief Market Strategist
www.TheTechnicalTraders.com


