Have The Global Markets Already Reached A “Critical Mass” In Terms Of Recovery?
A recent Forbes article suggesting global market leverage had reached new all-time highs prompted me and my research team to begin to explore the question of whether “global markets already reached a critical mass in terms of post-COVID-19 recovery”? If this is true, what would it mean for the rest of 2021 and into early 2022?
Behavioral Economics suggests people spend more when the value of their assets rise
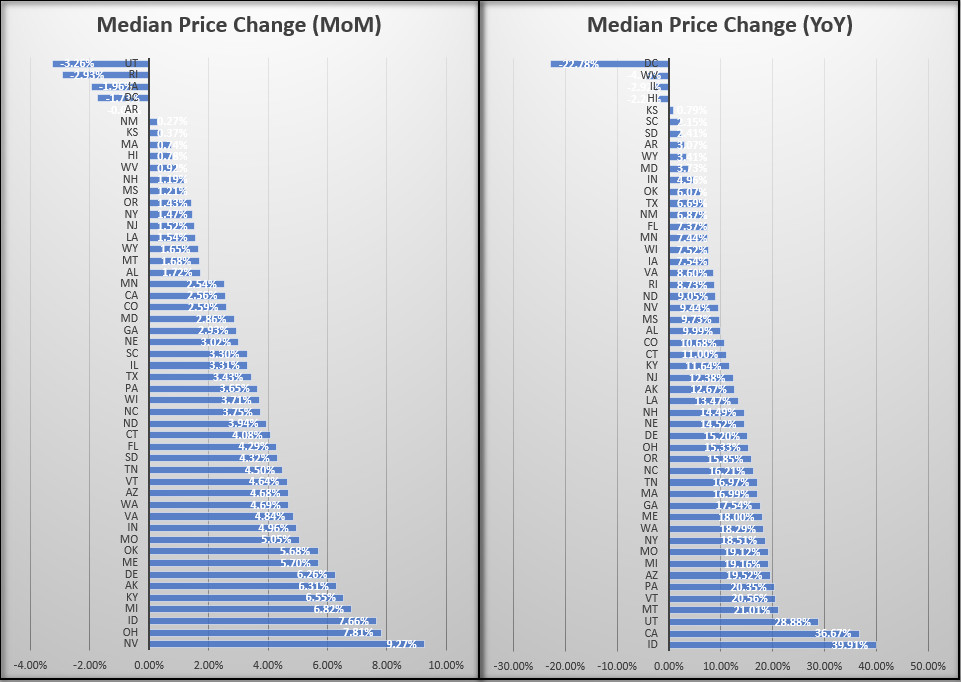
Recent US policies have created an environment where extremely low supply of houses for sale have resulted in an extremely hot sellers market. Homes are selling very quickly in most cases and sometimes for well over the asking price. Over the past 12 months, average US home prices have risen over 10% in most areas. Over the past 90 days, some areas have seen home prices start to decline from the highest growth levels.
This current, March 2021, data shows how the real estate market dynamics are changing state-by-state.
Ranking the Top-10 MoM and YoY states based on this data, only three fall into the Top-10 for both measures of growth: Idaho, Michigan, and Missouri. The others fall out of the Top-10 in terms of MoM and YoY growth alignment. This suggests some of the hottest real estate growth trends may be changing.
Additionally, the really in real estate has also aligned with a commodity cycle rally phase that is sending some hard assets skyrocketing. We’ve seen some incredible trending in the US stock market and various market sectors recently. Since the COVID-19 bottom, Lumber has rallied almost 500% in the past 12+ months. Over that same span of time, Corn has rallied over 142% and Crude Oil has rallied over 590% (from a assumed low of $10.07 on April 27, 2020).
Sign up for my free trading newsletter so you don’t miss the next opportunity!
Meanwhile, the S&P500 (SPY) has rallied more than 90% since the March 2020 COVID-19 lows and the NASDAQ (QQQ) has rallied more than 108%. Additionally, the biggest rallies in various market sectors have seen bullish trends rallying over 370% in ARKW, over 350% in HAIL, and over 525% in PBW.
Certain Sectors Starting To Show Signs Of Contraction
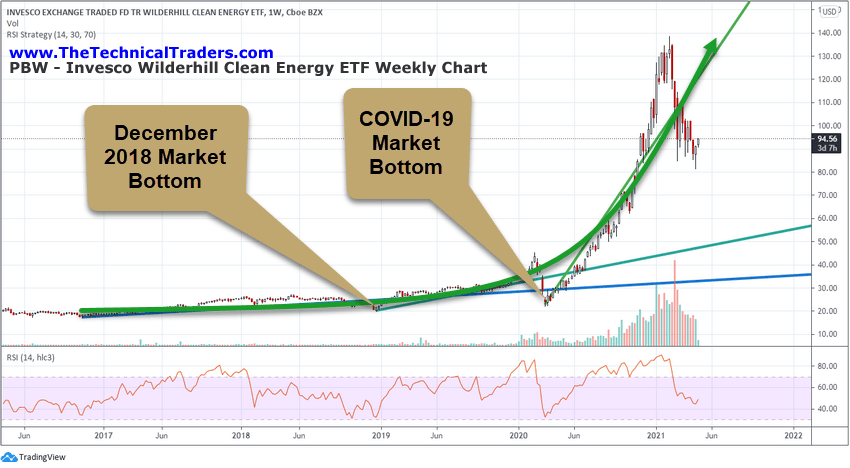
Obviously, compared to the pre-COVID-19 stock market price volatility/ranges, which you can see from the PBW Weekly chart below, the US stock market entered two new rally phases – each after deep price corrections and related to US Federal Reserve and global central bank easing policies.

As the upward price trend accelerated after each market dip, traders and investors became more and more convinced the Federal Reserve would install more easy money policies to support the US stock market. This continuous process of dip then recovery prompted a massive increase in US market sector trending and leverage, as detailed by our recent article entitled “MARKET LEVERAGE REACHES NEW ALL-TIME HIGHS AS THE EXCESS PHASE RALLY CONTINUES“.
We believe the current market trends are continuing to suggest a broad shift in how capital is deployed throughout the global markets is currently underway. The shift in the hottest real estate trends, as well as US and global market sectors, are starting to ease off the stronger trends we saw near the end of 2020.
The PBW chart, above, highlights a perfect example of this. After reaching a peak level of $138.60 on February 10, 2021, PBW has contracted more than -40% to a low of $81.29 recently. Historically, if we look at price appreciation going back 12 months or longer, PBW is still rallying quite strongly – even though the recent trending has been decisively downward.
We feel many market sectors may react in a similar manner as capital continues to seek out the best investment opportunities throughout 2021 and into 2022. The incredible rally phase that has taken place in the US stock market, various sectors and in Crypto Currencies over the past 5+ months has created a massive wealth-effect that is hard to deny. Behavioral Economics suggests people spend more when the value of their assets rise.
Everything that has transpired since the US Federal Reserve moved rates back to ZERO, which happened after the October 2018 market decline, has acted in a manner to accelerate the wealth-effect of the US and global markets – prompting moderate hyper-inflation in some areas. As long as the US Federal Reserve continues to support these policies, traders should continue to take advantage of how capital transitions into various sectors/assets and stay cautious of a sudden shift in consumer sentiment.
Real Estate should continue to trend moderately higher as long as this upward trending is not broken by a sudden FED shift in policy. It is the same thing with sector trends – price levels should continue to attempt to rally if the FED continues to support assets and support easy money policy through 2022.
Smart traders will quickly identify these phases of the market and will understand how this Excess Phase rally should continue to play out. Ride it as long as you are able to profit from these trends – but be cautious of how, when, and how violently it will end. You can learn more about how I identify and trade these sectors by registering for my FREE step-by-step guide.
For those who believe in the power of trading on relative strength, market cycles, and momentum but don’t have the time to do the research every day then my BAN Trader Pro newsletter service does all the work for you with daily market reports, research, and trade alerts. More frequent or experienced traders have been killing it trading options, ETFs, and stocks using my BAN Hotlist ranking the hottest ETFs, which is updated daily for my premium subscribers.
Happy Trading!
Chris Vermeulen
Founder & Chief Market Strategist
www.TheTechnicalTraders.com


