The S&P 500 Continues To Climb, See What Sectors Are Set to Climb Even Higher
While you may not have been paying attention, some of the strongest sectors are already showing great strength and setting up for new breakout rallies. Over the past 30+ days, sector trends have rotated as the market volatility has increased. Right now, we are seeing strength in some of the same sectors that were leading the markets 60+ days ago: Discretionary, Comm Services, Technology, Energy, Financials, and Real Estate. If you are not paying attention to these trends, you may miss some of the best assets to trade given big sector ETF moves we’ve seen in early 2021.
Strongest Sectors Lead With Big Trends
Existing trends, investor expectations, and government policies all work together to drive forward trends and expectations in sectors. Looking at the following 30-day sector comparison graph from www.StockCharts.com, we can see that Discretionary, Energy, and Financials have been the strongest sectors over the past 30+ days. Comm Services, Technology, and Real Estate are close behind.
It is important to understand how these sectors and rotational trends within these sectors create opportunity when breakout patterns become evident. With continued strength in these sectors, traders can attempt to take advantage of potentially explosive upside trends before the breakouts take place.
Home Construction Showing Potential – +12% or more
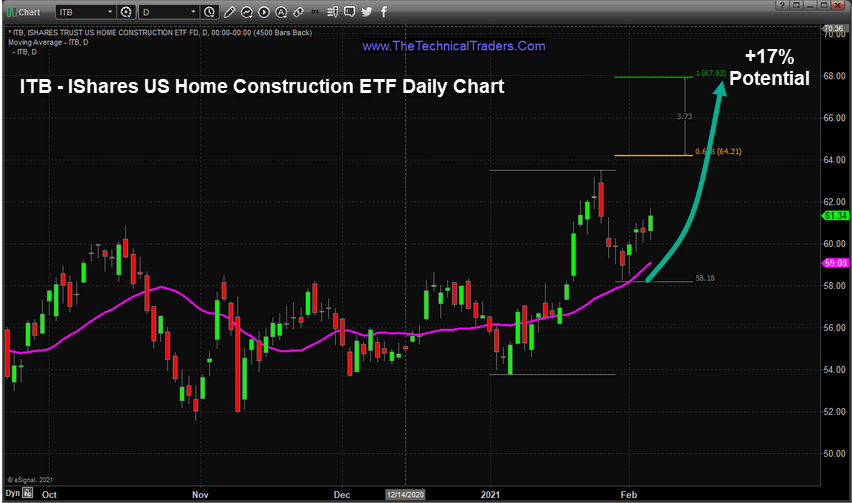
I will start off by illustrating the opportunities in ITB, the US Home Construction ETF. This Daily ITB chart highlights our use of the Fibonacci Extension tool to attempt to pinpoint upside price targets based on past price trends. The recent bottom near $58 suggests an upside price trend is likely to attempt to break above $64 while targeting $64.20 & $68. From the lows of this move, this represents a 17%+ rally where 12%+ of this move has yet to complete. The key to this upside breakout rally is for ITB to rally above $64.

Regional Banking May Breakout Much Higher- +10% or more
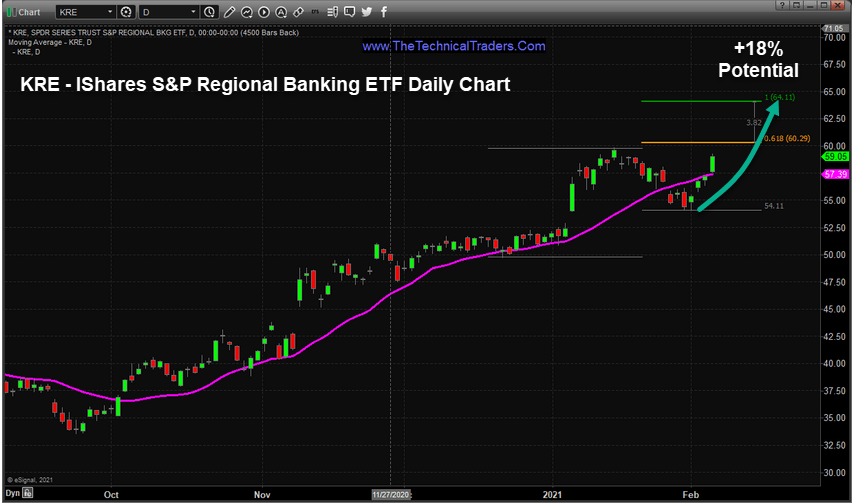
Next, we will focus on Regional Banking with KRE, the S&P Regional Banking ETF. This Daily KRE chart, again, highlights our use of the Fibonacci Extension tool to attempt to pinpoint upside price targets based on past price trends. The recent bottom near $54 suggests an upside price trend is likely to attempt to break above $64 while targeting $60.00 & $63.60. From the lows of this move, this represents a 18%+ rally where 10%+ of this move has yet to complete. The key to this upside breakout rally is for KRE to rally above $60.
Be sure to sign up for our free market trend analysis and signals now so you don’t miss our next special report!
Take special notice of the recent upside price rally that has recovered nearly all of the recent downside price rotation. KRE appears to be trending higher quite nicely and may attempt a breakout rally very soon.

Energy Sector Still Has Great Potential – +11% or more
Last, we will focus on opportunities in Energy with XLE, the SPDR Energy ETF. This Daily XLE chart highlights our use of the Fibonacci Extension tool to attempt to pinpoint upside price targets based on past price trends. The recent bottom near $39 suggests an upside price trend is likely to attempt to break above $43.80 while targeting $44 & $47. From the lows of this move, this represents a 20%+ rally where 11.5%+ of this move has yet to complete. The key to this upside breakout rally is for XLE to rally above $44.

The similarities of these setups/pending upside breakout trends are not by accident. The strongest market sectors have recently rotated downward and have begun to resume the upward price trends. When this happens, the Fibonacci price extension utility we use to highlight the next most logical upside price targets can become very accurate for trading targets. Additionally, the opportunities of these trends, ranging from 8% to 18% or more based on the current setups, provides some very real opportunities should these breakout trends continue higher.
Sector trends can become a very powerful tool for traders to consistently find and execute profitable trades in bigger trends. 2021 is going to be full of these types of trends and setups. Quite literally, hundreds of these setups and trades will be generated over the next 3 to 6 months in various sectors and our BAN Trader Pro technology can help you find the best setups. The BAN Trader Pro technology does all the work for us.
As traders begin to realize the upward price potential as they see this rally momentum build, we believe a shift in thinking will take place. As some sectors fail, others will begin to trend higher. We watch these sectors to determine what are the best sectors to trade based on relative strength and momentum and then trade their respective ETFs. I call this my Best Asset Now, or BAN, strategy.
My subscribers and I are loving the strategy – we took out three ETF trades in the three hottest sectors and one Index trade and all are moving up nicely after only 2.5 days. We hit our 7%, 15%, and 20% targets for one of our trades within 48 hours, and continue to ride the remainder of our position in that trade up until we are stopped out! This is how we make money while still getting that awesome, excitable feeling from being in an explosive, possibly parabolic, trade!!
Don’t miss the opportunities in the broad market sectors over the next 6+ months, which will be an incredible year for traders of the BAN strategy. You can sign up now for my FREE webinar that teaches you how to find, enter, and profit from only those sectors that have the most strength and momentum. Learn how the BAN strategy can help you spot the best trade setups because staying ahead of sector trends is going to be key to success in volatile markets.
For those who believe in the power of trading on relative strength, market cycles, and momentum but don’t have the time to do the research every day then my BAN Trader Pro newsletter service does all the work for you with daily market reports, research, and trade alerts. More frequent or experienced traders have been killing it trading options, ETFs, and stocks using my BAN Hotlist ranking the hottest ETFs, which is updated daily for my premium subscribers.
Have a great weekend!!
Chris Vermeulen
Chief Market Strategist
www.TheTechnicalTraders.com


