Should You Be Concerned About The Big Downside Rotation In The US Markets?
RESEARCH HIGHLIGHTS:
- Don’t panic. Technical Analysis does not confirm a deeper price correction at this time, nor does this appear to be the Bull-Trap we have been warning about… yet.
- We are waiting until next week to see if price confirms any new trend.
- Volatility should decrease if this is just a moderate price rotation.
Is this the “Bull-Trap” setup we have been warning about for some time now? Should traders be concerned about deeper downside price trends or a collapse in the markets?
We believe this current downside price rotation is just a well deserved (and somewhat overdue) price rotation related to the recent advance in stock valuations. Currently, the VIX is moving lower and the volume in the markets is suggesting the deepest part of this price move may be over (for now). Bonds are moving lower while precious metals are moderately higher. We don’t believe this current downside price move has any more momentum left – at least headed into the long holiday weekend.
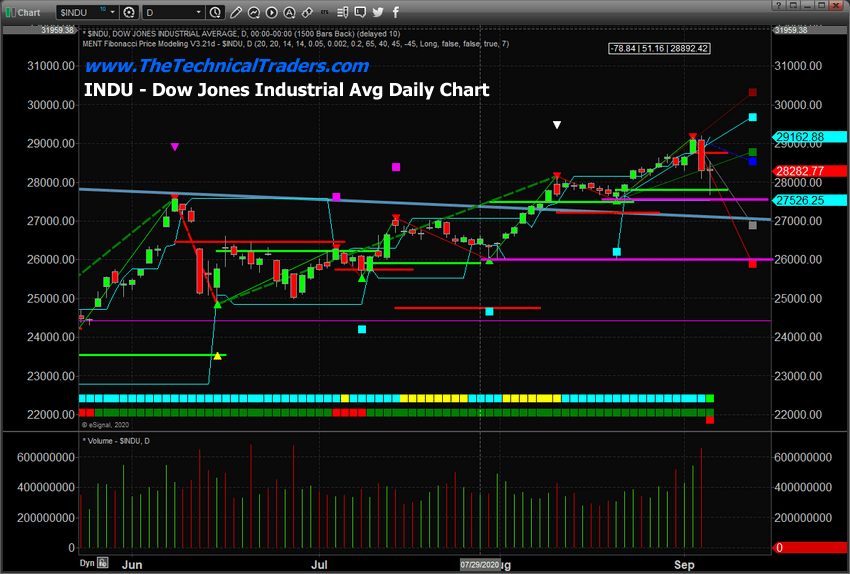
This Daily INDU chart below highlights two key price levels that are acting as support right now, the 27,525 and 26,000 levels. This recent downside price rotation stalled very close to the 27,525 level and began to rally from those lows.

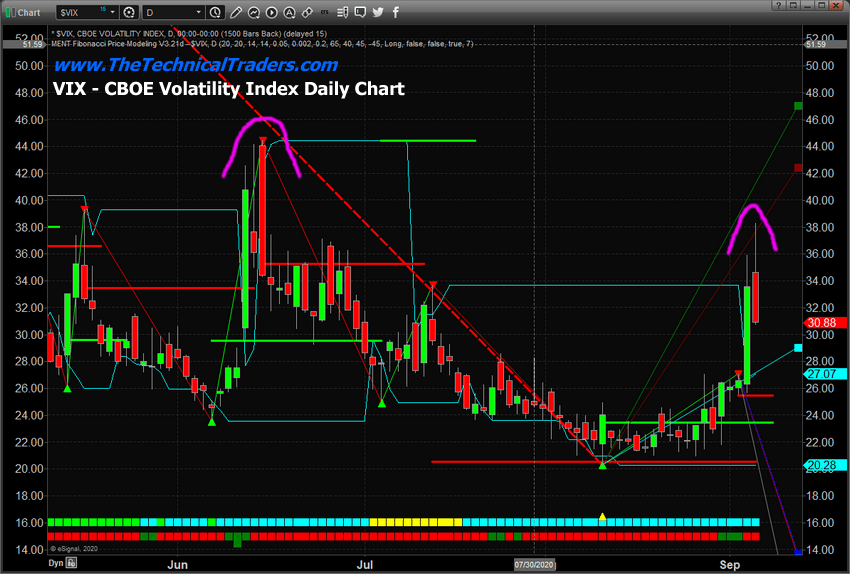
The following VIX chart highlights the recent peak in volatility levels, near 38, and also shows how quickly the momentum shifted back towards “recovery” from these lows. I am adopting a “wait and see” stance to see how things progress next week or two. The one thing we can state with a degree of certainty is that volatility has nearly doubled and risks have increased in the markets – yet we don’t have any technical confirmation the Bull-Trap has been sprung (yet).
We are still urging traders to protect active long positions from potential risks as we will have to wait to see what happens early next week and beyond to see if the bullish trend resumes dominating the market bias going forward. The VIX had spiked to levels above 36 over the past – nearly doubling from the recent low price levels. If there is any new risk in the markets over the days or weeks then this high volatility will continue.

We’ll post more research on Sunday, September 6, 2020. In the meantime, watch for price levels to attempt to stabilize near 28,540 on the INDU (which is another key support level). This is just a moderate downside price rotation at this stage of the game. No new technical triggers have confirmed a broader, deeper technical trend.
Get our Active ETF Swing Trade Signals or if you have any type of retirement account and are looking for signals when to own equities, bonds, or cash, be sure to become a member of my Passive Long-Term ETF Investing Signals which we are about to issue a new signal for subscribers.
Chris Vermeulen
Chief Market Strategist
Technical Traders Ltd.
NOTICE AND DISCLAIMER: Our free research does not constitute a trade recommendation or solicitation for our readers to take any action regarding this research. It is provided for educational purposes only – read our FULL DISCLAIMER here. Visit www.thetechnicaltraders.com to learn how to take advantage of our members-only research and trading signals.


