Crude Oil Breaks Lower – Sparking Fears Of Another Sub $30 Price Collapse
RESEARCH HIGHLIGHTS:
- Breakdown in Crude Oil sparks talk of sub $30 price targets.
- Initial support likely near $32 to $33.
- Predictive Modeling suggests deeper price lows may be reached before November 2020.
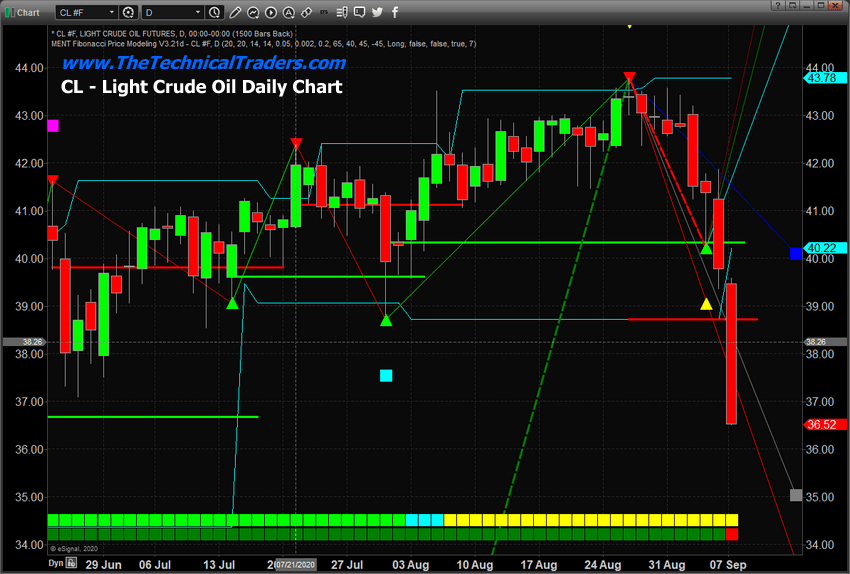
Have you been paying attention to Crude Oil recently? Prices have collapsed over -15% from the recent highs near $43.78. You may remember a research article I posted originally in July 2019 suggesting a big breakdown in Crude Oil was going to take place in early 2020 and extreme volatility was likely between February 2020 and April 2020. Our researchers predicted the following within that research article:
“If our ADL predictive modeling is correct, we will see rotation between $47 and $64 over the next 3+ months before a breakdown in price hits in November 2019. This will be followed by two fairly narrow price range months (December 2019 and January 2020) where oil prices will tighten near $45 to $50. After that tightening, we believe an extremely volatile price move will happen in February through April 2020 that could see oil prices trade as low as $22 and as high as $51 over a two to three-month span.”
Then, in early March 2020, we published this follow-up article on our Crude Oil predictions. Within that article, we updated our analysis to include the following statement:
“If our research is correct, Crude oil may find a bottom somewhere near $17 to $24, the potential rally back up to somewhere above $37~41 ppb before staging another massive selloff. The massive volatility suggested by the ADL system also suggests a broad price range over the next 60+ days.”
BREAKDOWN IN CRUDE TARGETING SUB $30 LEVELS
Currently, Crude Oil prices have broken into a deep downward collapse after reaching highs near $44 ppb. The extended topping formation above $41 ppb aligns with our earlier research suggesting the broad market peak in Crude Oil over the past three months may have setup another breakdown event as the global markets react to renewed economic fears and the continued COVID-19 event.
Our Adaptive Dynamic Learning (ADL) predictive modeling system is currently suggesting deeper price lows, initially targeting $32 to $33, then possibly falling below $27.50, are likely followed by an extended period of congestion below $30 throughout the end of November. In reality, Crude price levels could fall below $22 on a broader market selloff, then recover to levels above $24~28 before entering the congestion period we are describing.

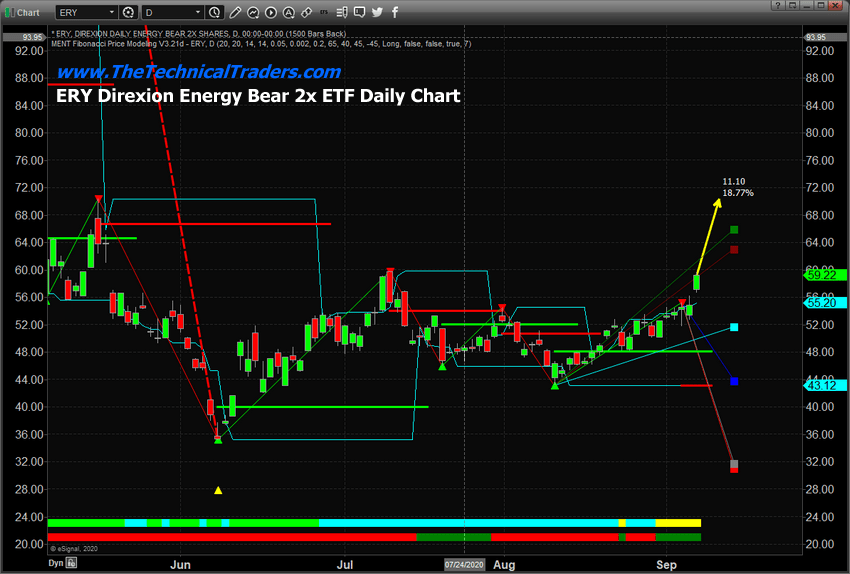
We believe ERY may rally 15% to 20%+ as Crude Oil collapses. The timing and setup, as well as the technical confirmation from our ADL predictive modeling system, suggests ERY could rally at least 11% to 14% over the next few days and weeks. The extended lower price consolidation that we are expecting may prompt ERY to rally an additional 5% to 8% if a deeper price low in Crude Oil, below $25, is established.
Be sure to sign up for our free market trend analysis and signals now so you don’t miss our next special report!
We don’t believe Crude Oil will attempt to target the COVID-19 lows at this time. We believe a roughly 61% price collapse from recent highs is likely based on a Fibonacci Retracement of COVID-19 lows to the recent highs. This places an immediate target price level for Crude Oil below $32.76 ppb. Our ADL system predicting a target price below $30 ppb suggests a deeper price move is highly likely. Thus, we believe a move to levels below $30 is highly likely with support being between $25 to $30. Our Fibonacci Price Modeling system places critical support near $28.30.

Once Crude Oil reaches the bottom and finds support, we’ll be re-evaluating the potential for further price activity and trends. We want to warn you that once Crude Oil establishes the support level below, or near, the $30 ppb level, it will likely enter an extended sideways consolidation phase until after November 11, 2020. So be prepared for some potentially volatile sideways price activity after the bottom is established.
Isn’t it time you learned how I can help you better understand technical analysis as well as find and execute better trades? If you look back at past research, you will see that my incredible team and our proprietary technical analysis tools have shown you what to expect from the markets in the future. Do you want to learn how to profit from these expected moves? If so, sign up for my Active ETF Swing Trade Signals today!
If you have a buy-and-hold or retirement account and are looking for long-term technical signals for when to buy and sell equities, bonds, precious metals, or sit in cash then be sure to subscribe to my Passive Long-Term ETF Investing Signals to stay ahead of the market and protect your wealth!
Chris Vermeulen
Chief Market Strategist
Technical Traders Ltd.
NOTICE AND DISCLAIMER: Our free research does not constitute a trade recommendation or solicitation for our readers to take any action regarding this research. It is provided for educational purposes only – read our FULL DISCLAIMER here. Visit www.thetechnicaltraders.com to learn how to take advantage of our members-only research and trading signals.


