Could A Volatility Spike Be Pending? Skilled Traders Beware!
Article Highlights
- Low Market Volumes Suggest The Risk Of A VIX Spike Is Heightened
- VIX Flag Pattern May Be Warning Of A Big Rollover Risk In The Global Markets
- Global Trade and The US Presidential Election Event May Prompt A Volatility Event
- Risks Are Elevated
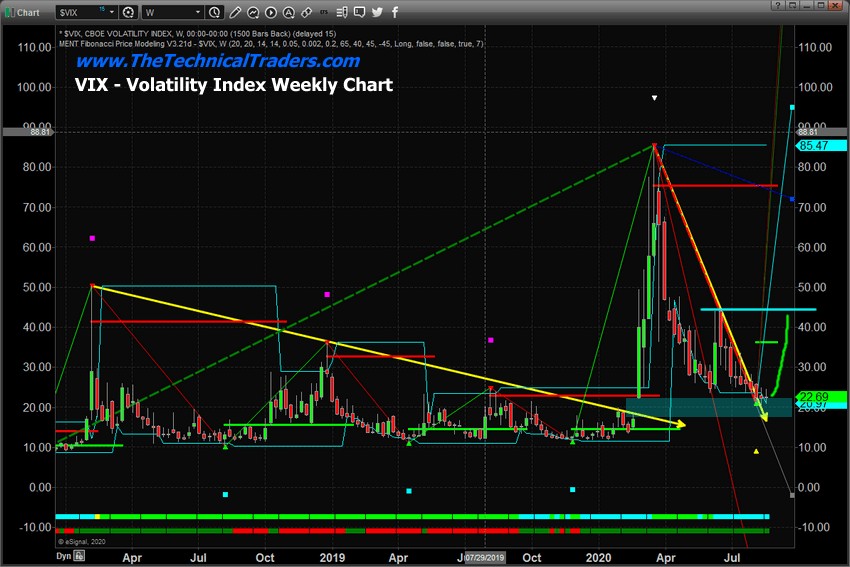
Recently, my research team and I authored an article about how Gold and Silver were setting up in a type of historical pattern that may be warning of a “rollover” in the US stock market and a potential upside price rally in Gold and Silver. Today, we believe further evidence of potential rotation in the stock market has set up – a VIX consolidation pattern that may lead to a new upside price spike in the Volatility Index
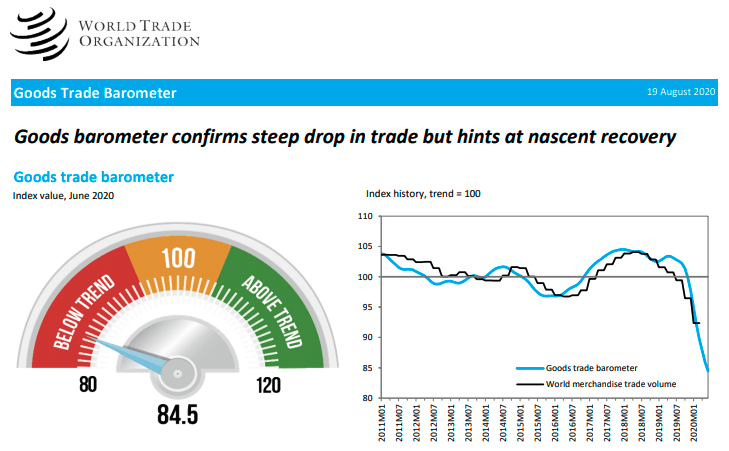
A recent article featuring the Goods Trade Barometer below shows the collapse in global trade related to the geopolitical concerns and global tensions between the US and China as well as India and China are presenting a real issue for global stock market valuations. As many of you are already aware, the recent rally in the US stock market has been driven by only a handful of symbols from technology and other sectors – this is not a broad market rally.

As Fall and Winter set in where schools are re-opening and multiple states are attempting to re-open, the risk of a new phase of COVID-19 becomes a strong concern. Adding all of this together in addition to the markets recently reaching new all-time highs and we believe an 8% to 15% downside price move in the US stock market is a very real possibility.
Be sure to sign up for our free market trend analysis and signals now so you don’t miss our next special report!
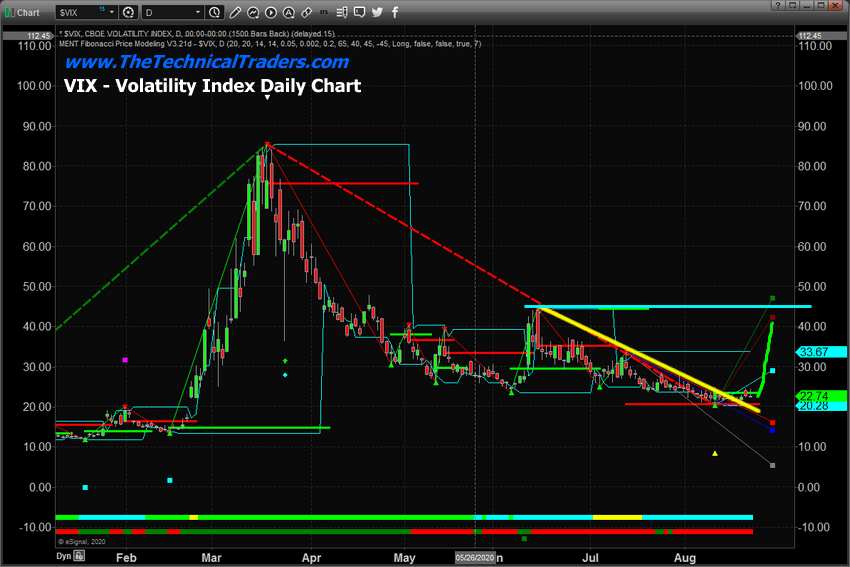
With global trade at the lowest levels over the past 10+ years and the potential for a new wave of political and geopolitical concerns weighing on the global financial markets, we believe the VIX levels, currently below 23 and setting up a downward trend-line breakout, could move above 35~40 over the next 30 to 60+ days very easily. A downside move of nearly 8% to 11%, or more, in the US Stock market would push the VIX index above 30 very quickly. This could happen because of news of a conflict somewhere in the world, or because of geopolitical issues, or because of the US Presidential election and the potential for a dramatic change in US policy.

As you can see from the VIX Daily Chart, above, the lower VIX levels that have extended beyond the downward sloping VIX channel/Flag line (in YELLOW). This suggests a VIX Spike may soon appear which would likely be associated with a downside price move in the US stock market. Our research team believes a move above 35~40 is very likely at this point.
The original GAP that was created when the COVID-19 collapse started on February 25 continues to stay open/unfilled, see below. We believe this GAP level will stay unfilled as a VIX Spike, and downside price correction in the US stock market originates because of global concerns and unknowns related to the 2020 US Presidential election event.

The Dow Jones and other major indexes have recently stalled near peaks. Trading volume is very low by historical comparison. It is very likely that any financial or news event could prompt a moderately large downside move in the global stock market – resulting in a big VIX Spike.
Although the VIX spike we expect may not happen right away, skilled traders should be very aware of the risks associated with open long trades at times like these. Remember how quickly previous VIX spikes destroyed profits in many traders’ portfolios. The big GAP move in February 2020 resulted in a nearly -14% collapse in the Dow Jones over less than 10 days – and then the markets collapsed another 15% or more. Pay attention and stay cautious right now.
If you found this informative, then sign up now to get a pre-market video every day before the opening bell that walks you through the charts and my proprietary technical analysis of all of the major assets classes. You will also receive my easy-to-follow ETF swing trades that always include an entry price, a stop, two exit targets, as well as a recommended position sizing. Visit my Active ETF Trading Newsletter to learn more.
While many of you have trading accounts, the most important accounts are long-term investment and retirement accounts. If your long-term investment accounts are not protected during a time like this, you could lose 25-50% or more of your entire net worth in a few days. We can help you preserve and even grow your long term capital when things get ugly (like they are now) and scary (as we expect them to soon be).
If you have any type of retirement account and are looking for signals when to own equities, bonds, or cash, be sure to become a member of my Long-Term Investing Signals, which includes a weekly market update and trade alerts.
Stay healthy and rest easy at night by staying informed through our services – sign up today!
Chris Vermeulen
Chief Market Strategist
Founder of Technical Traders Ltd.
NOTICE: Our free research does not constitute a trade recommendation, investment or trading advice, or solicitation for our readers to take any action regarding this research. It is provided for educational purposes only. I produce these research articles to share information with you in an effort to try to keep you informed. Visit our web site (www.thetechnicaltraders.com) to learn how to take advantage of our members-only research and trading signals.


