2018 SILVER MARKET TRENDS | Silver Institute
(Washington D.C. – January 18, 2018) Of all the metals in the periodic table, silver enjoys one of the most versatile landscapes, with its uses found in a wide variety of applications. Silver’s unrivaled characteristics serve many industrial products, while its weight and neutral color make it very popular in jewelry that suits many occasions. As a precious metal, silver serves as a store of value and can provide stability against the cycles of economic adversity. As such, factors influencing the silver market primarily range from developments in the industrial and jewelry sectors to changes in the macroeconomic sphere that affect investor sentiment.
With this in mind, the Silver Institute provides the following insights on 2018 market trends.
Silver Demand
Silver demand from industrial applications, the largest component of silver offtake representing 60% in 2017, is expected to continue to grow this year. Due to silver’s unrivaled electrical conductivity, it will continue to play a vital role in major industry sectors that are moving towards increased electrification, such as automotive. Although silver is used in small quantities in some applications, the diversity is large, and the continued rising volumes of applications are expected to again have a positive impact on silver consumption from industrial products this year.
The strong increase in demand for small and large scale solar panels across the globe has boosted the demand for silver in photovoltaic applications in recent years, reaching an estimated 92 Moz (million ounces) in 2017. We expect the growth to continue this year and set another record for silver demand, driven by large scale solar capacity additions and continued strong demand uptake from individual households, particularly in China.
Jewelry demand is expected to continue its steady increase in 2018, expanding consumption by another 4%, following a rise of 1% in 2017. Silver demand from the jewelry sector accounts for approximately one-fifth of total silver demand. Many would argue that silver’s features lend themselves better than gold to fashionable jewelry because of silver’s color neutrality, which provides more versatility for many fashion-conscious consumers.
Coin demand almost halved to 73 Moz in 2017. Much of the weakness was concentrated in the United States where a buoyant stock market and parabolic increases in cryptocurrencies diverted some capital away from physical precious metals. With equity and bonds in “expensive” territory and Bitcoin’s stratospheric increase taking a breather during the beginning of 2018, we expect some investment to flow back into precious metals, benefiting silver bar and coin demand this year.
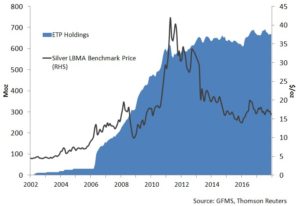
Silver exchange-traded-products (ETP) holdings achieved a record high at 670 Moz at the end of 2017. Since their introduction in 2002, silver ETPs have recorded a small decline in total annual holdings only twice, indicating the stickiness of their nature among investors (this is in part since a relatively high proportion of silver ETP investors are individuals rather than institutions). Although growth has been somewhat stable since 2012, drawdowns of silver ETPs are far and few between. We expect ETP holdings to rise an approximate 3% this year.
Chart: Silver ETP Holdings and LBMA Benchmark Price (RHS)

Indian silver imports reported a strong year in 2017, almost doubling to 183 Moz compared to the previous year. The strong increase is a combination of healthy jewelry demand and a shift from business conducted previously in cash to more formal channels. The implementation of the Goods-and-Services-Tax (GST) has had a positive effect on that development. Indeed, silver demand from jewelry, silverware, coins and medallion retailers, who prefer a more transparent business model, substantially rose last year in India. In 2018 we expect silver demand from jewelry fabricators to remain strong, pushing imports to approximately 180 Moz.
Silver Supply
Global mine supply fell 1% in 2016, the first annual decline following 14 years of consecutive growth. In 2017 that trend continued with mine output expected to contract by a further 2% to 870 Moz. Production disruptions out of South America, along with a decline in capital expenditure among the primary producers in the past five years, is expected to constrain output again this year. However, the strong recovery in base metal prices will provide some support to output in 2018, particularly from by-product producers capitalizing on the trend.
Silver generated from scrap supply improved slightly last year on stronger recycling waste generated from the manufacturing process. Scrap supply has been in a strong decline since 2011 due to a contracting pool of near market silverware, jewelry and coins. Scrap is expected to stabilize around 150 Moz this year, which equates to around 15% of total supply.
Silver Market Balance
The silver market balance (total supply less total demand) is expected swing into a slight market deficit again this year with both supply and demand reaching above 1 billion ounces. Silver from above ground stocks will have to be drawn down in order to serve the shortfall. That will be a welcome development as above ground stocks rose 9% last year in the face of weak physical demand from the United States and Asia.
Silver Price
The silver price fell by just half a percent last year to an average of $17.05/oz. This year we expect the silver price to experience a volatile ride. Short covering in the beginning of the year has already propelled the price above last year’s average. On a ratio with gold, currently at around 72, silver has plenty of room for improvement and to migrate towards its long-term average of around 64. With physical gold investment likely to be robust via risk-hedging, silver should benefit by proxy, given the propensity of professional speculators to leverage gold exposure through silver, and retail investors to buy silver instead of gold if they cannot afford the latter.


